.png)
A rising star in the IDE battles is VSCode from Microsoft. It's cross-platform, not sluggish or bloated like some other IDEs, and seems to walk the line between being easy to use and giving users the ability to add features via extensions, similar to Sublime's Package Manager.
One nice thing about VSCode is it makes remote GDB debugging via Lager very easy. In this example we'll walk through setting up GDB debugging using GDBServer + Lager in order to remotely debug an IMXRT1050 MCU. And if you don't yet have VSCode installed on your computer, here's a guide we put together to get going with VSCode and WSL on Windows.
Setting Up VSCode For C Debugging With GDB
Since VSCode is a multi-language IDE it doesn't have built-in on-target debugging for embedded C. To do that we'll need to install the C/C++ extension from the VSCode extension manager.
- {% c-line %}Ctrl+Shift+X{% c-line-end %} to bring up the extension manager
- Search for {% c-line %}c/c++{% c-line-end %}
- Or download here
- If you're using WSL make sure to install on WSL, not local
- Once it's installed add a debug configuration to your project by running {% c-line %}Run > Add Configuration{% c-line-end %} and choose {% c-line %}C/C++{% c-line-end %}. This will create a folder in your project called {% c-line %}.vscode{% c-line-end %} that includes a file called {% c-line %}launch.json{% c-line-end %}. Modifying this file is how we enable on-target debugging
We're going to replace the default {% c-line %}launch.json{% c-line-end %} values with the below:
{% c-block language="json" %}
{
"version": "0.2.0",
"configurations": [
{
"name": "Launch gdb-multiarch",
"type": "cppdbg",
"request": "launch",
"miDebuggerPath": "/usr/bin/gdb-multiarch",
"miDebuggerArgs": "--cd=${workspaceFolder} --nx",
"MIMode": "gdb",
"program": "${workspaceFolder}/path/to/debug/image",
"setupCommands": [
{"text": "set remotetimeout 5"},
{"text": "target remote localhost:3333"},
{"text": "monitor reset halt"},
{"text": "file 'path/to/debug/image'"},
{"text": "load"},
{"text": "break main","ignoreFailures": true}
],
"launchCompleteCommand": "None",
"externalConsole": false,
"cwd": "${workspaceFolder}"
}
]
}
{% c-block-end %}
Let's inspect each of the keywords in the above file
{% c-line %}"version"{% c-line-end %} - Self explanatory
{% c-line %}"configurations"{% c-line-end %} - Where task configuration is kept
{% c-line %}"name"{% c-line-end %} - A summary of what this task will do. Anything descriptive is fine
{% c-line %}"type"{% c-line-end %} - Which extension we're going to use
{% c-line %}"request"{% c-line-end %} - Options or launch a debugger or attach to an existing debug process
{% c-line %}"miDebuggerPath"{% c-line-end %} - The debug client we want to use. In this case we're using gdb-multiarch installed on WSL. If you're using a different client (e.g. arm-none-eabi-gdb for MinGW on Windows you would need to make sure to have the right path)
{% c-line %}"miDebuggerArgs"{% c-line-end %} - The command line arguments you'll be passing to miDebuggerPath
{% c-line %}"MIMode"{% c-line-end %} - The debugger that VSCode will connect to, in this case gdb. Other option is lldb
{% c-line %}"program"{% c-line-end %} - The executable the debugger will launch. This is so that VSCode can load the debug symbols.
{% c-line %}"setupCommands"{% c-line-end %} - These are commands that will be run by the debug client, in this case gdb-multiarch after it starts (as opposed to command line options). The following commands are specific to a gdb client connecting to a gdb server.
{% c-line %}"text"{% c-line-end %} - the raw command that will be run from the gdb client
{% c-line %}"ignoreFailures"{% c-line-end %} - If a setupCommand fails, ignores, pretty much like the name implies
{% c-line %}"launchCompleteCommand"{% c-line-end %} - Command to run once the debugger has finished launching
{% c-line %}"externalConsole"{% c-line-end %} - Whether or not to spawn an external console
{% c-line %}"cwd"{% c-line-end %} - set the working directory of application launched by debugger. For embedded systems running on-target (i.e. not on host) this is ignored
For a full overview take a look at the VSCode launch.json reference guide.
Setting Up a Remote GDB Server
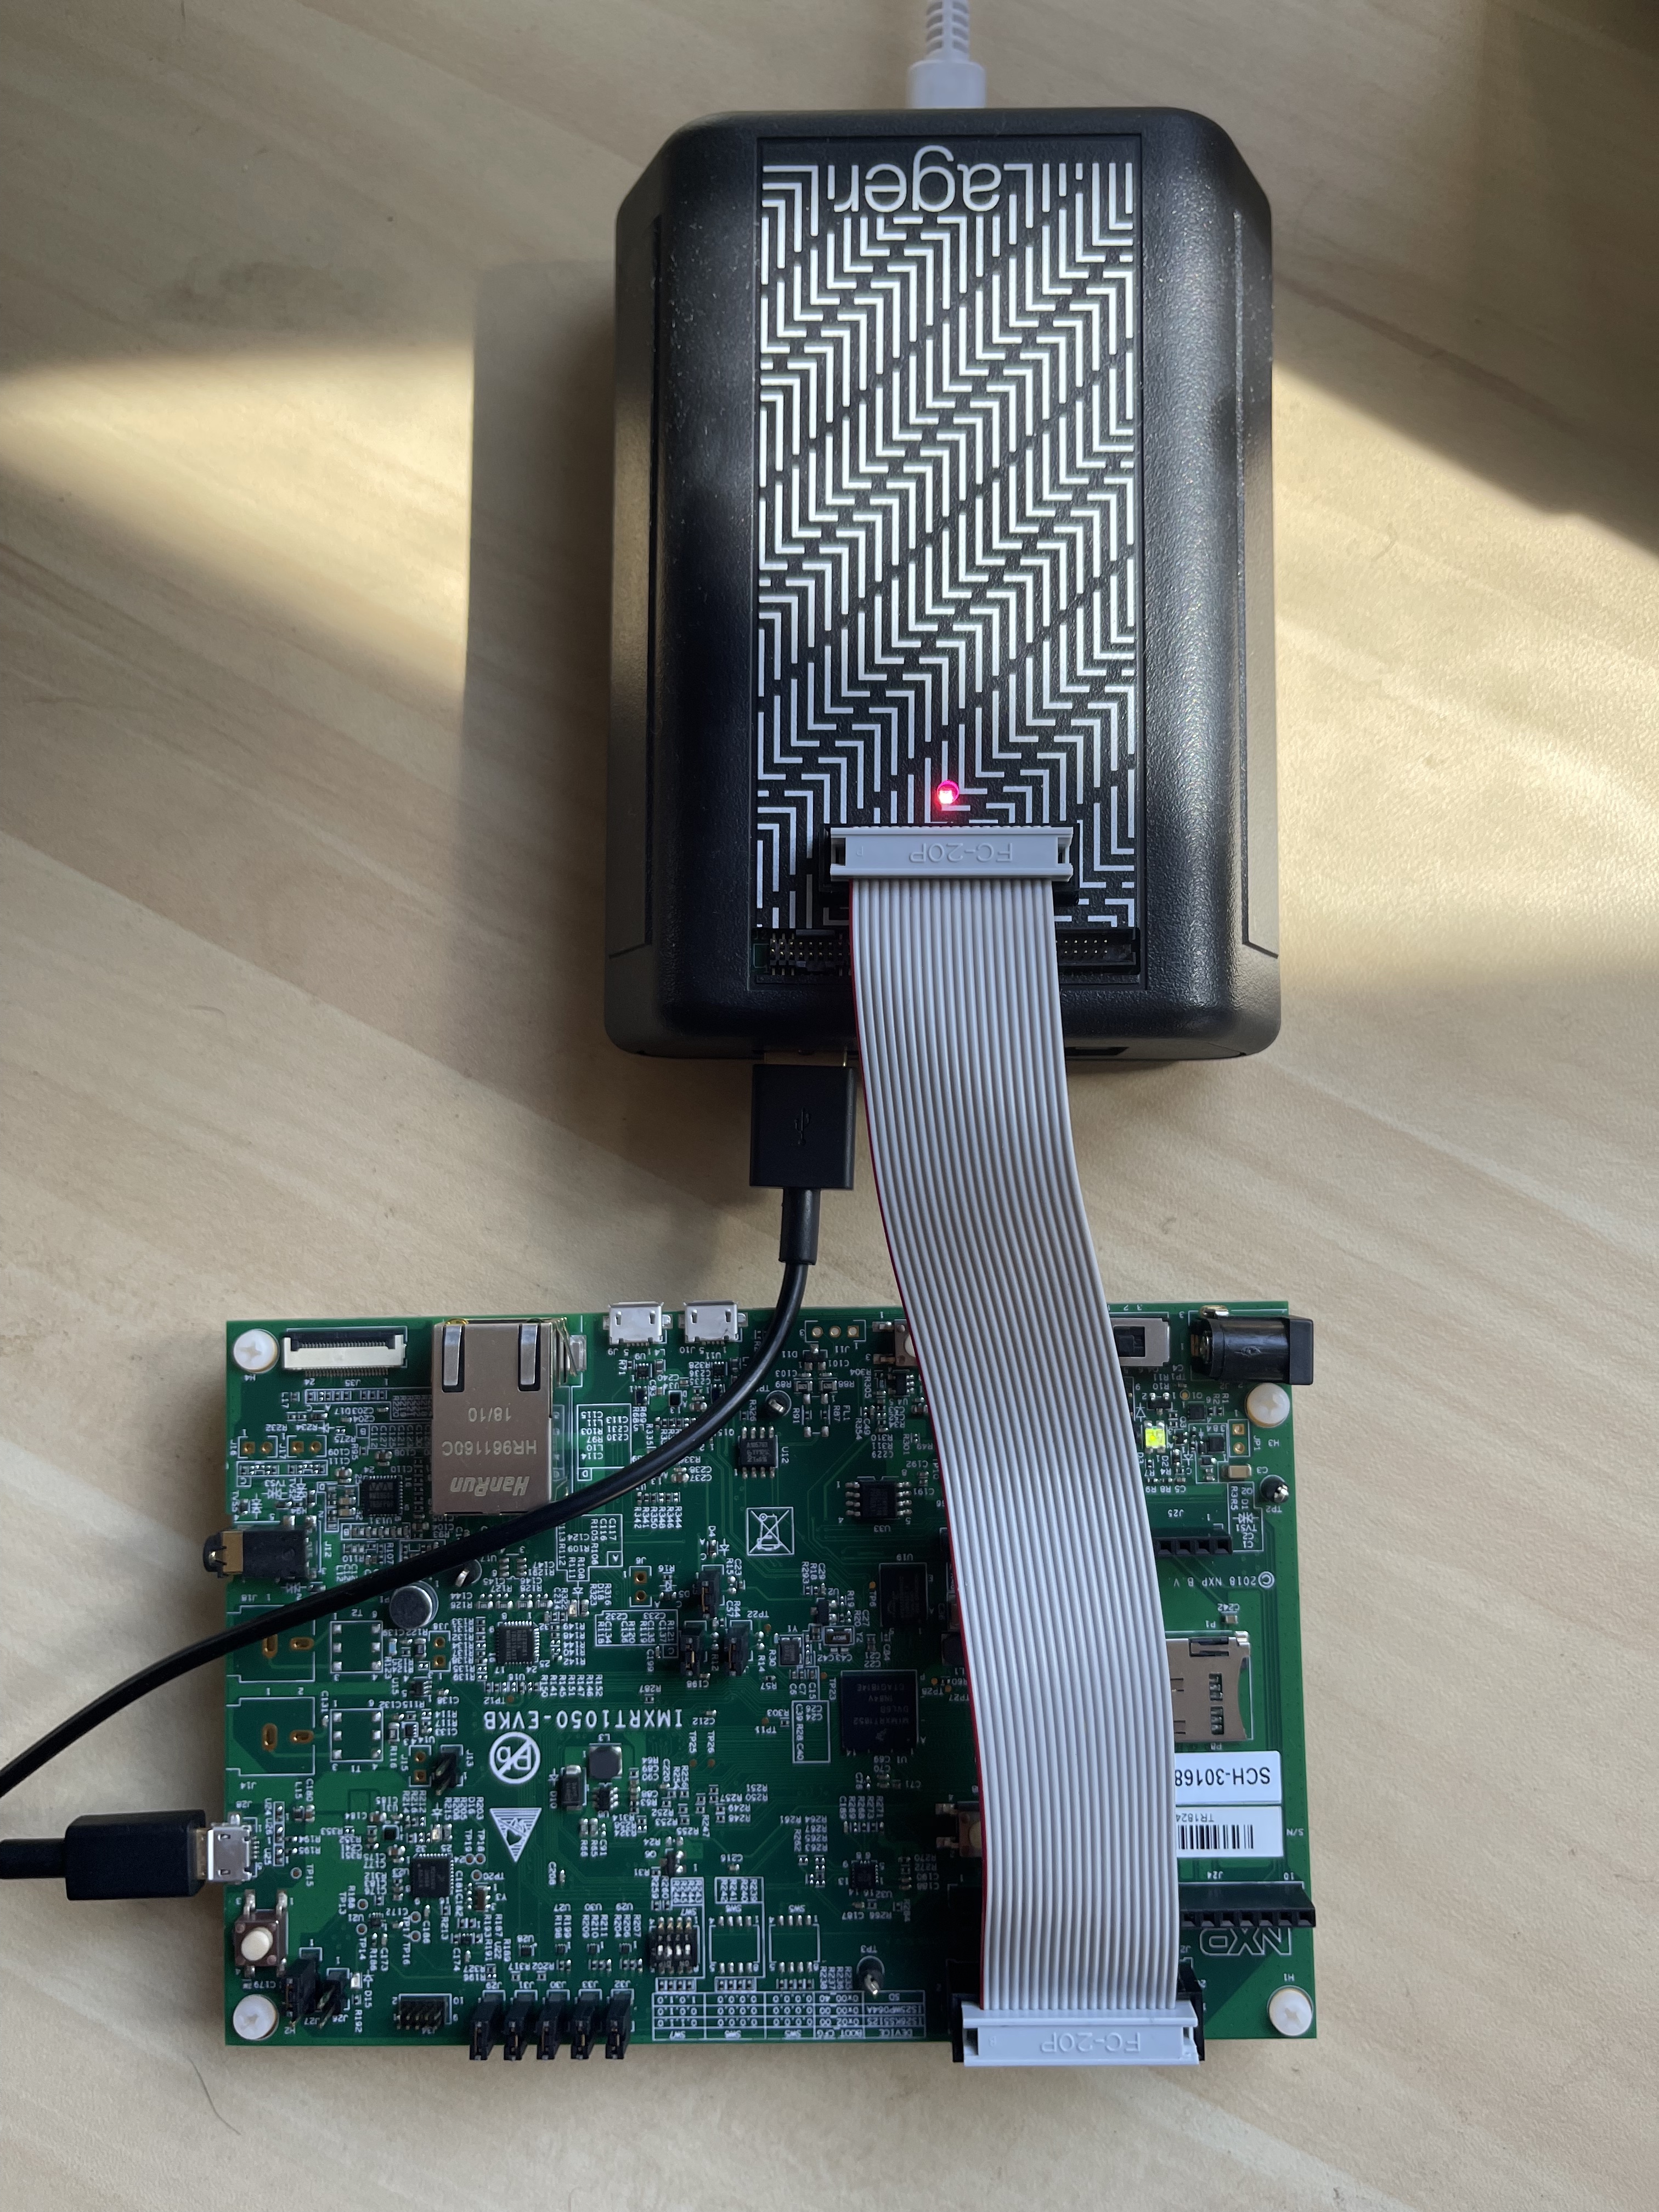
Before we start debugging we need to set up the other half of our debug pipeline, the GDB Server. To do that we're going to use Lager.
- Attach a board to a Lager Gateway either via SWD or JTAG using the 20 pin 100mil Gateway connector or the 10pin 50mil Gateway Connector
- In VSCode open a new terminal: {% c-line %}Ctrl+Shift+'{% c-line-end %}
- Connect debugger to hardware: {% c-line %}lager connect --device imxrt1050 --speed 1000{% c-line-end %}
- Start GDB Server: {% c-line %}lager gdbserver{% c-line-end %}
Start Debugging
Now that we have our debugging script set up, and we have the GDB Server running on our hardware we're able to start debugging using VSCode as our IDE. Simply press {% c-line %}F5{% c-line-end %} or {% c-line %}Run > Start Debugging{% c-line-end %} and that will launch the VSCode debugger. From here you can set breakpoints, add Watch variable, inspect registers, etc.
Example
Let's use a real life example to see everything in action using this public demo project we put together https://github.com/lagerdata/demo-imxrt1050-shell.
.svg)
